Getting Started
Launch Chronix2Grid
chronix2grid [OPTIONS]
- --case string
Case folder to base generation on. By default it will use case case118_l2rpn_neurips_1x within package data
- --start-date string
Start date to generate chronics
- --weeks int
Number of weeks to generate
- --by-n-weeks int
Size of the output chunks in weeks
- --n_scenarios int
Number of scenarios to generate
- --mode string
Steps to execute : L(K) for loads only (and KPI); R(K) for renewables (and KPI) only; LRT (K) for load, renewable and thermic generation (and KPI); LRDT(TK) for load, renewable, loss (dissipation) generation (and thermic and KPI)
- --input-folder string
Directory to read input files from. Please provide an absolute path. By default it will use a data folder within package
- --output-folder string
Directory to store output files. Please provide an absolute path. By default chronix2grid will write in a folder output/ within the working directory
- --seed-for-loads string
Input seed to ensure reproducibility of load generation
- --seed-for-res string
Input seed to ensure reproducibility of renewables generation
- --seed-for-dispatch string
Input seed to ensure reproducibility of dispatch
- --ignore-warnings
Ignore the warnings related to the existence of data files in the chosen output directory.
- --scenario_name string
Subname to add to the generated scenario output folder, as Scenario_subname_i
- --nb_core int
Number of cores to parallelize the number of scenarios
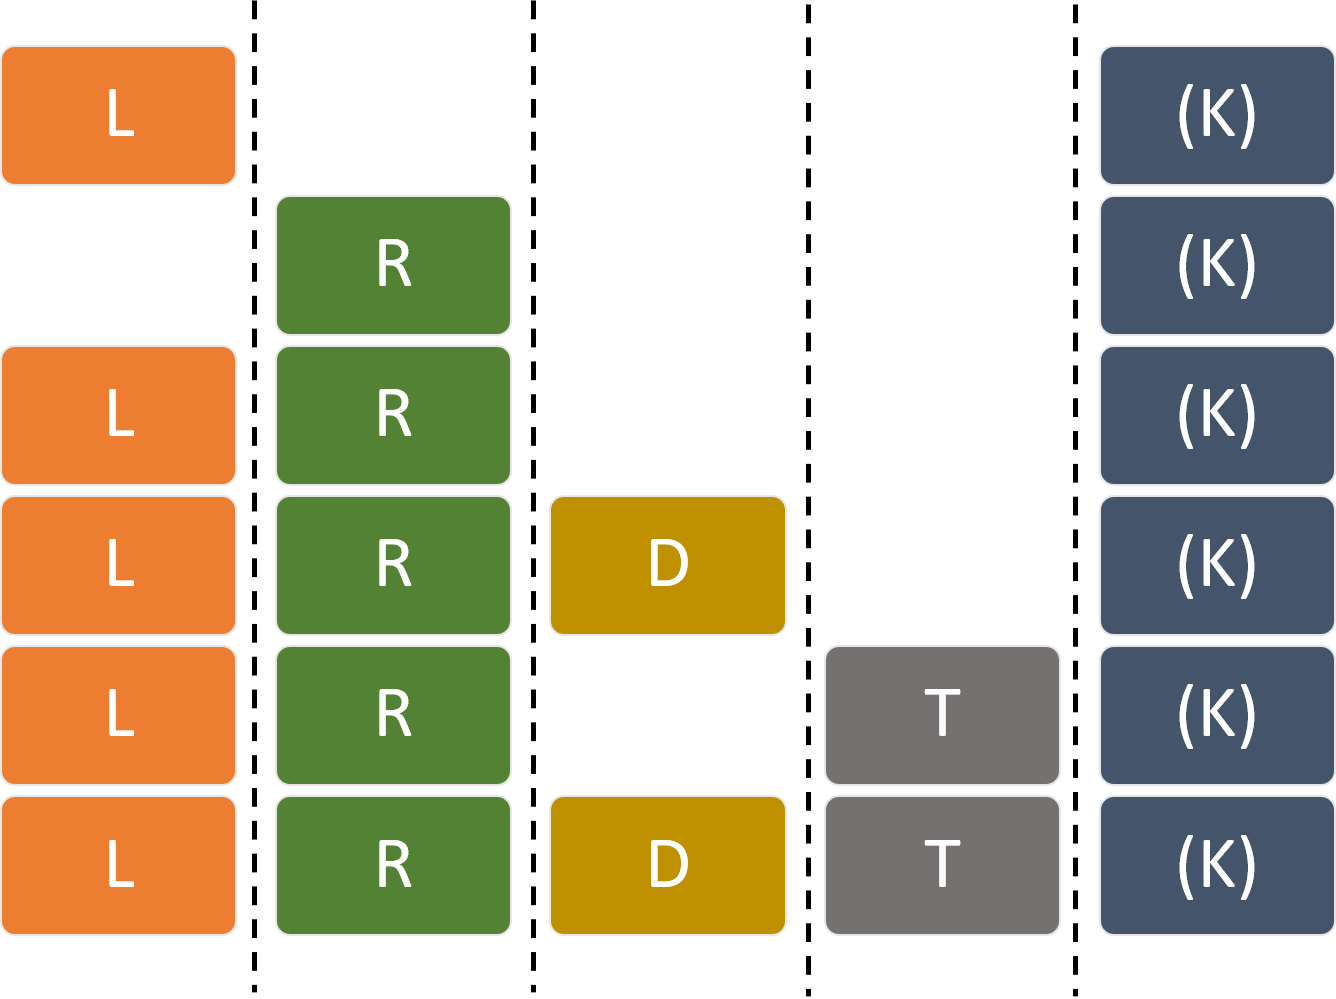
Features
4 generation submodules and a KPI module are available
L - load generation
R - wind and solar production generation
D - loss generation a priori, that will be used for dispatch and potentially corrected afterwards
T - thermic production generation thanks to a production dispatch (simplified optimal power flow computation)
K - KPI generation in order to compare synthetic (generated) chronics to reference (real-life) chronics
The figure below shows how these submodules can be launched together with –mode argument. Note that D and T submodules can’t be launched without previous L and R modules, and that KPIs can always been computed
Workflow and model interface
The global workflow of chronix2grid is illustrated below, and shows the API used to operate each step of the process.
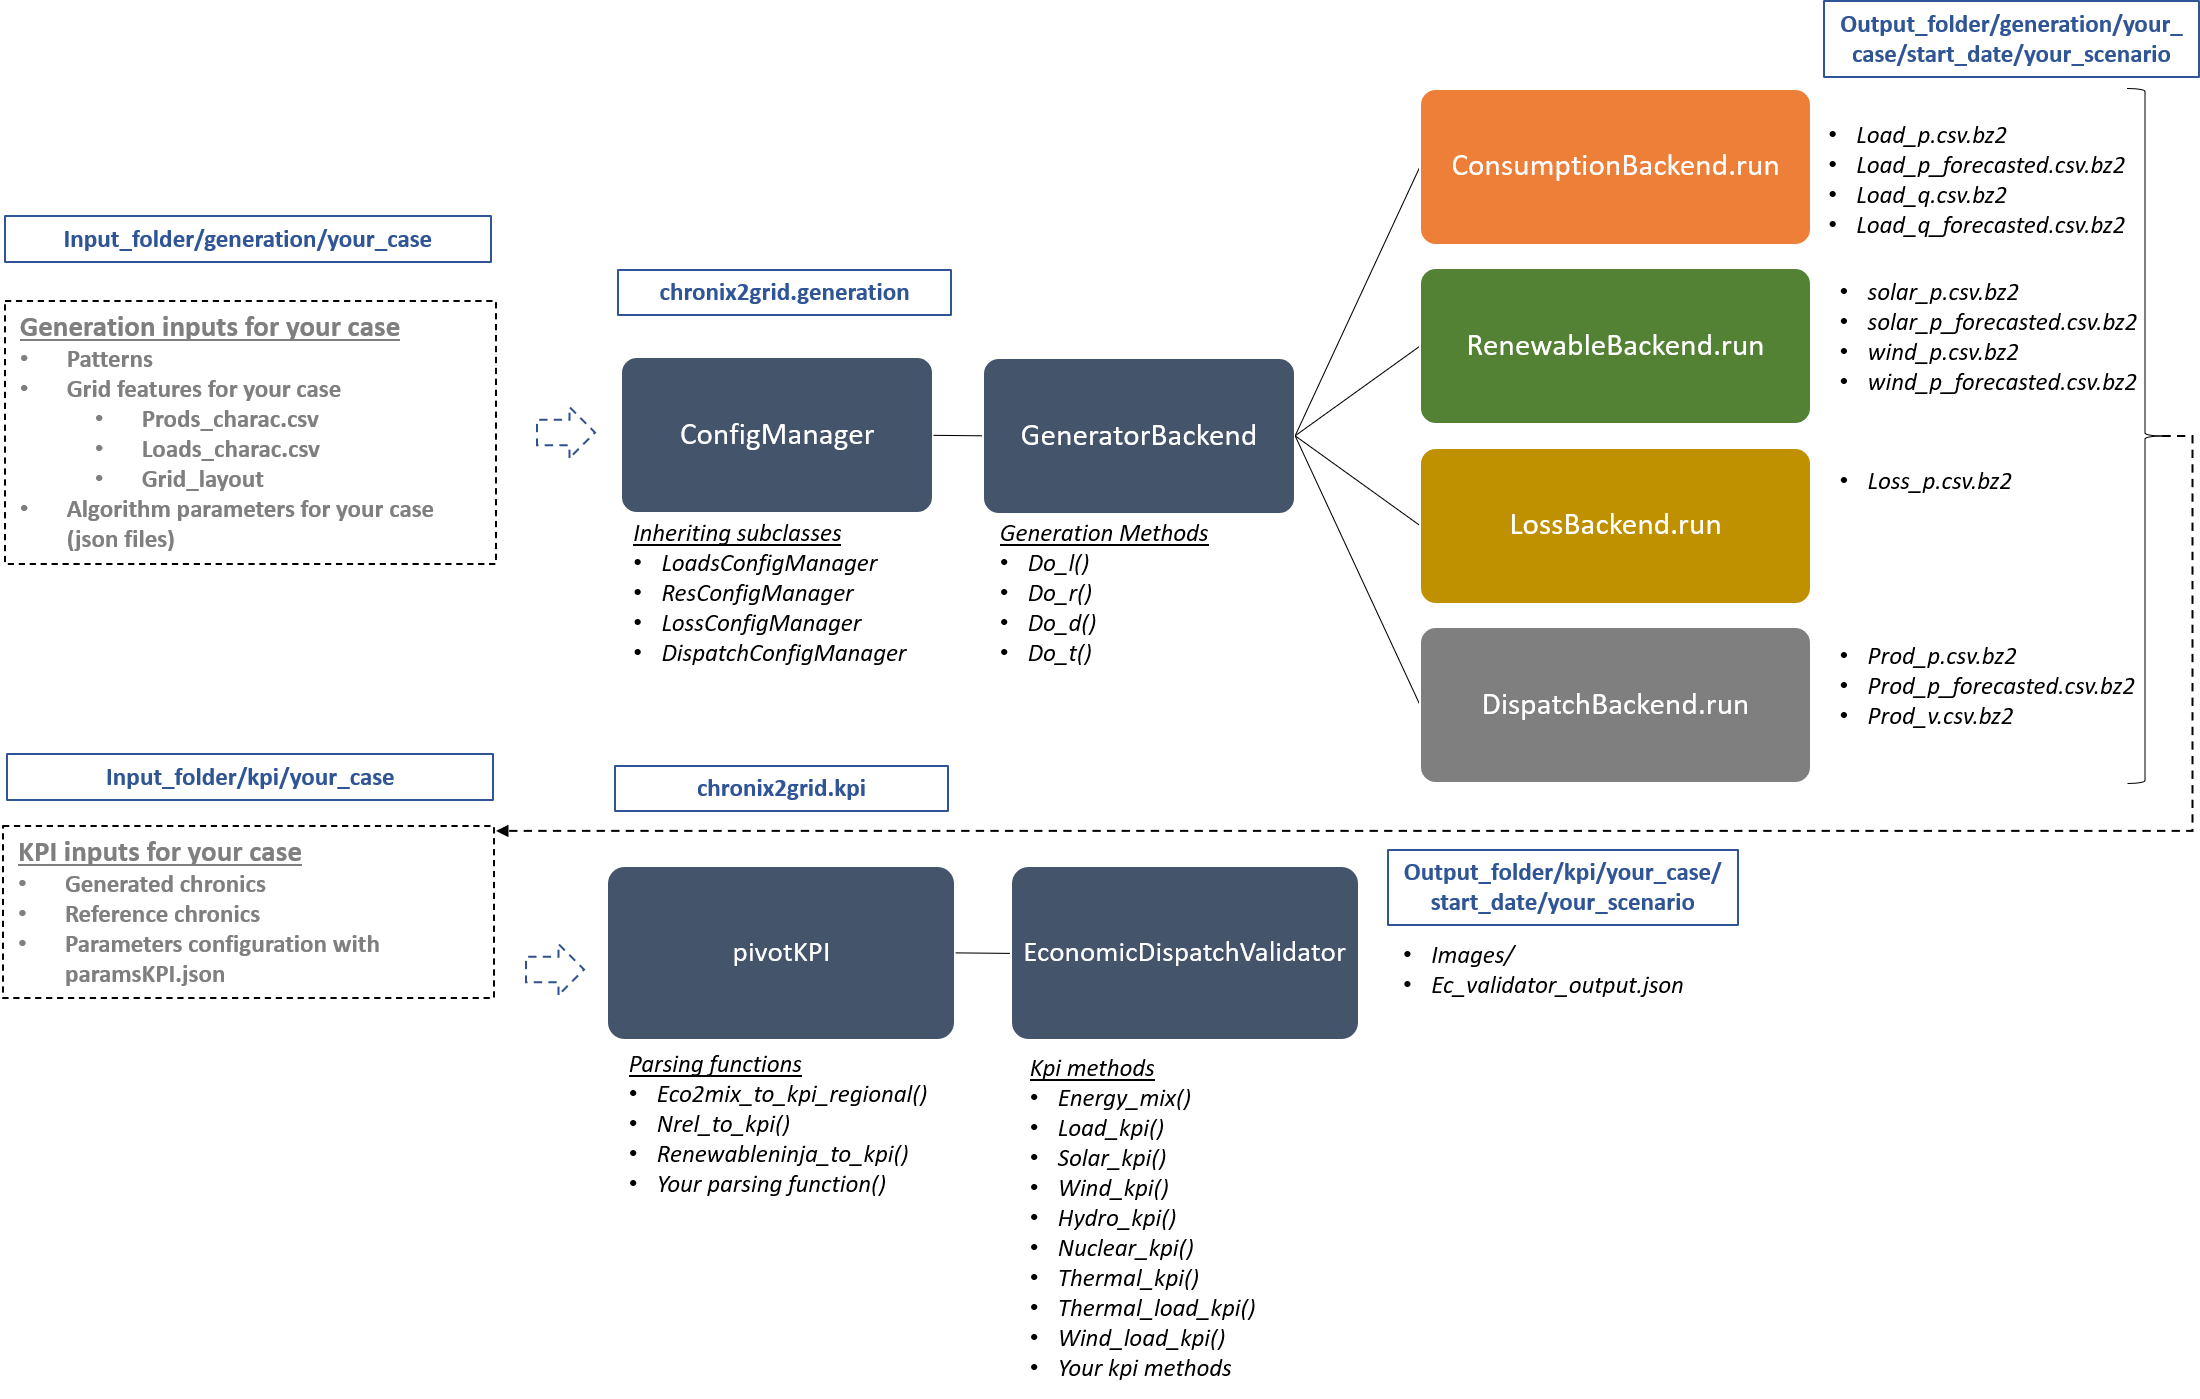
Note
All the class, methods and functions described in the image above are designed to be edited with your own generation models. See Interface API Overview.
Didactic examples
Four notebooks are provided to get you started with this package:
getting_started_cli.ipynb guide you through the use of chronix2grid cli
getting_started_api.ipynb is a more detailed notebook that presents chronix2grid api and showcases several ways to
analyze the chronics produced
running_chronics_grid2op.ipynb is a notebook giving an example of how generated chronics can further be used to create power grid scenarios and run them
analyze the chronics produced
RenewableNinja_Solar_WInd_KPI_format.ipynb is an example on how to retrieve Solar and Wind reference chronics from the [renewable ninja](https://www.renewables.ninja/) api. There will be use to compare the KPI’s with the generated chronics.
Additionally, a data starting kit is provided to run an example in the folder getting_started/example
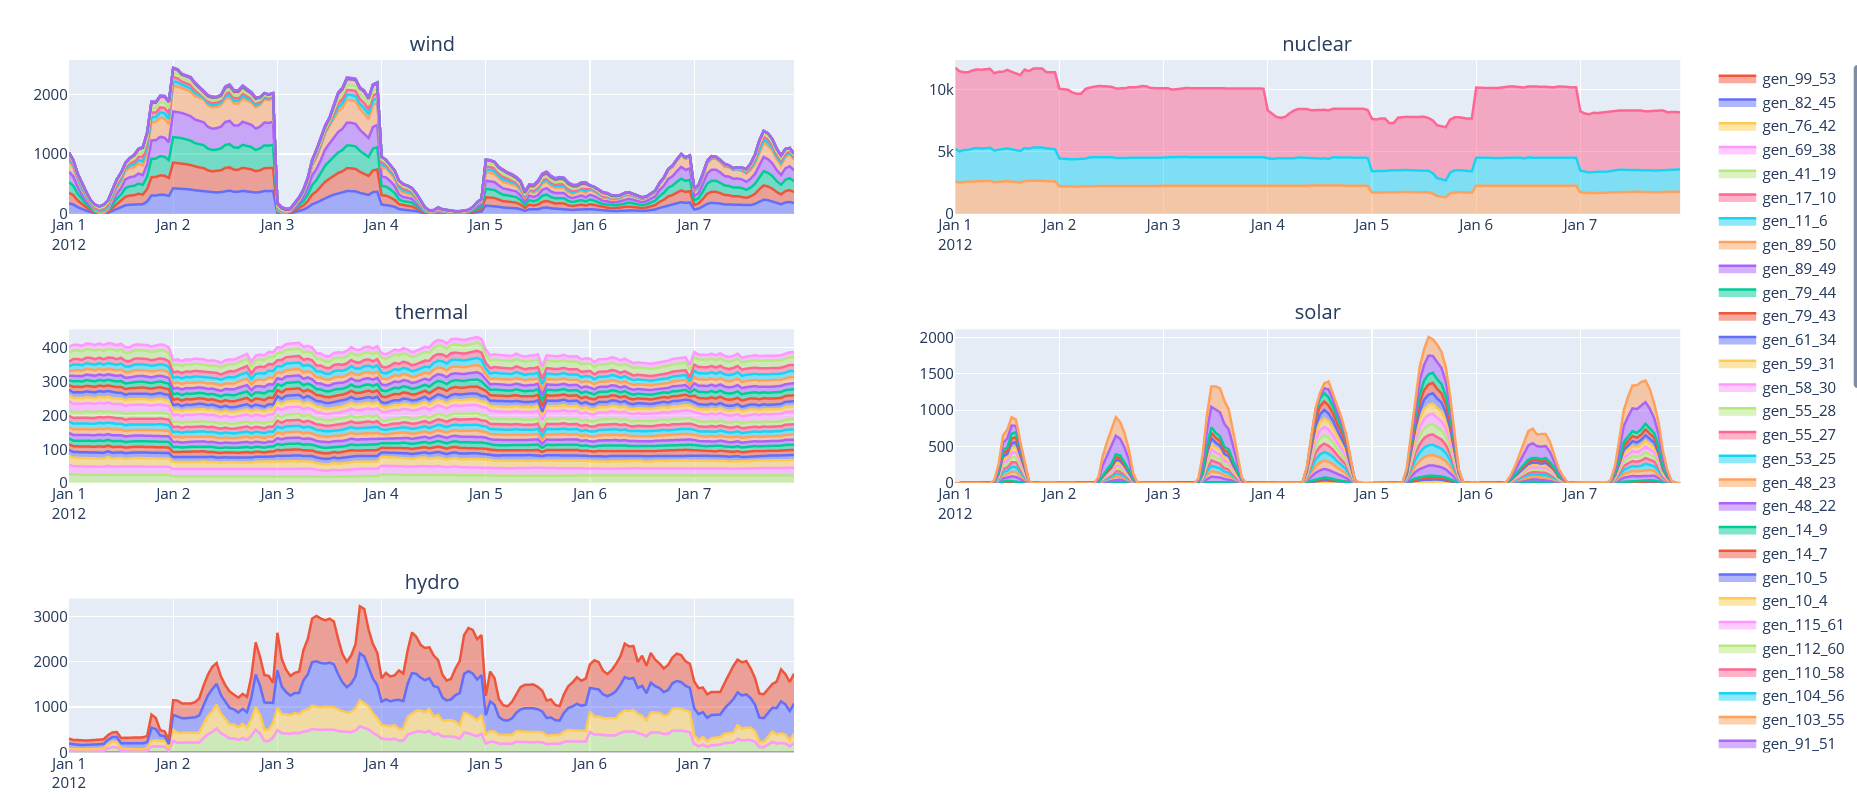
The output folder corresponds to the following run of chronix2grid :
chronix2grid --mode LRTK --weeks 4 --n_scenarios 1 --start-date 2012-01-01 --by-n-weeks 4
The generated production chronics by carrier on 4 weeks of january 2012 can be represented as below. Default input data from package will be used if no –input-data and –case is provided. It will be written in an output/ folder This visualization is available in interactive HTML format in output/kpi/case/scenario/images/dispatch_view/
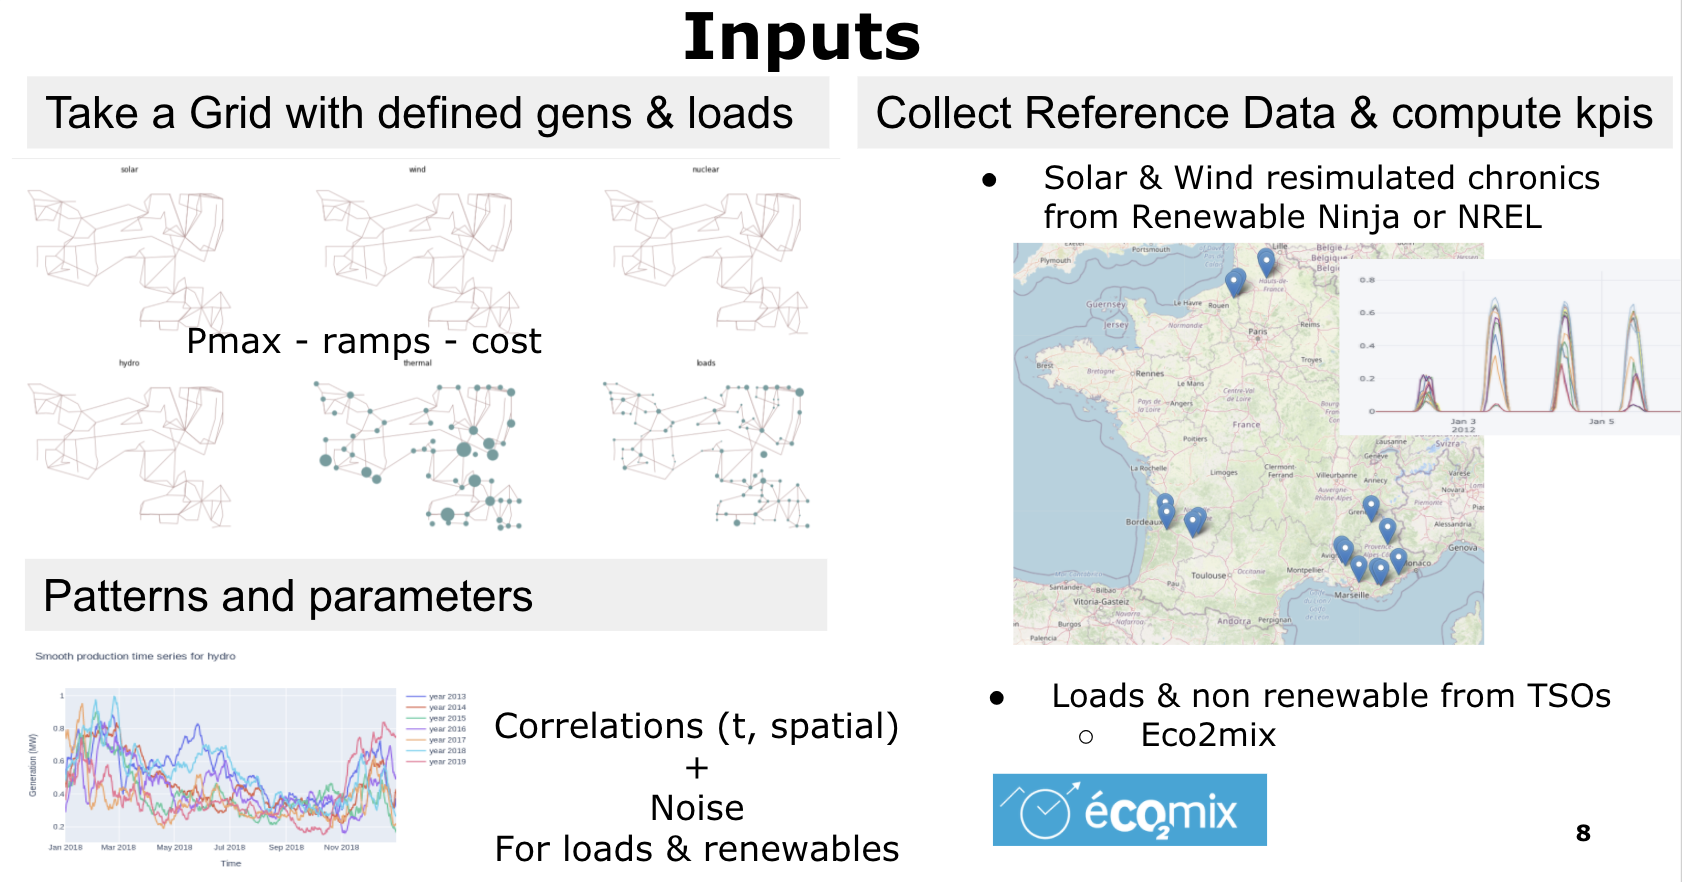
Inputs and Configuration
For synthetic chronic generation, one should provide
Data that represents grid, demand and generators characteristics. See getting_started/example/input/ for example.
Pattern data (ex: weekly load profile)
Json parameters for generation algorithms
One should also provide reference chronics data for comparison through a library of KPIs
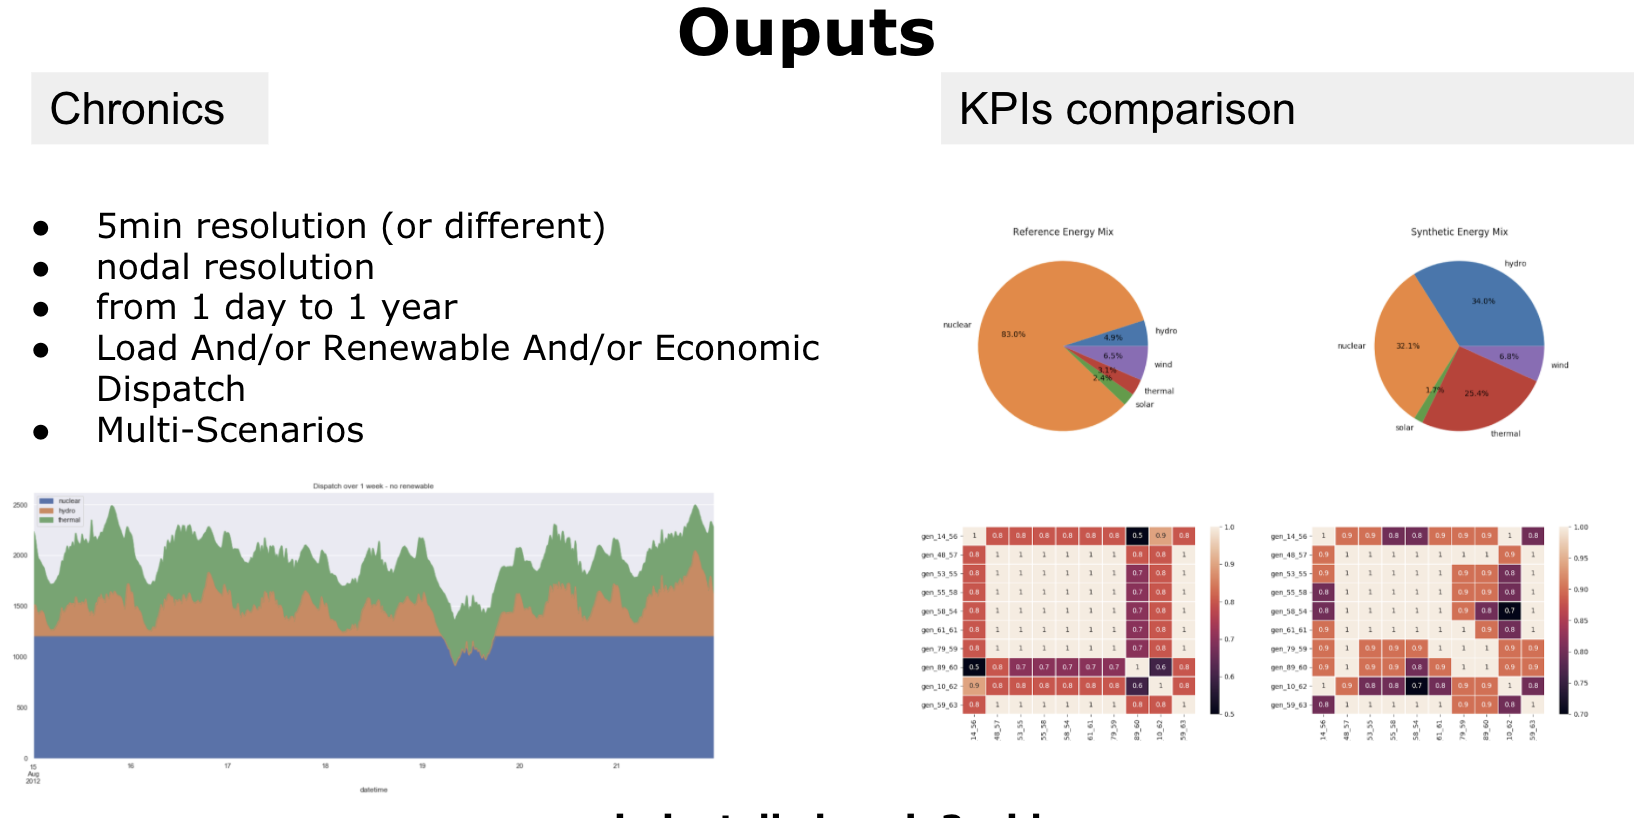
Outputs
The outputs are serialized chronics (that can be grouped by chunks) and the KPIs (images and interactive HTML files)
Tests
To launch the unit test suite:
pipenv run python -m pytest tests/unit_tests/ [--verbose -p no:warnings]
To launch integration tests:
pipenv run python -m pytest tests/integration_tests/ [--verbose -p no:warnings]
To launch the Command Line Interface (CLI) test (only if you installed chronix2grid package from Pypi)
pipenv run python -m pytest tests/cli_tests/
You can also analyse the coverage of the tests with coverage and generate an html report:
pip install coverage
coverage run --source=./chronix2grid -m unittest discover
coverage html
- This will generate a htmlcov folder containing a static web site with the analysis. Open index.html in a browser
to analyse it.